 Niraj Poudel
What additional reports?
The Sefaira web application makes it intuitive to setup and improve a project design. There is a focus on showing information in a new way so that comparisons can be made quickly and communicated between the design team.
However, there is a lot more information being processed than is shown in the web application which you could use to inform your design decisions. This article will show an example of how to take the output from Sefaira and explore further.
This example will show how to;
- Convert the annual information shown in Sefaira into monthly or hourly breakdown,
- Determine heating and/or cooling load info for each zone to inform sizing of tri-generation plant
Overview/Links of Previous Steps
- Create geometry in sketchup/revit and upload to Sefaira web application
- Setup location, HVAC system type, internal conditions and envelope baseline and note results from web application,
- Download, convert and run Energy plus file (.idf)
Converting from Annual to Monthly/Hourly Output
This can be done either in Energy Plus using the .idf editor or in a text editor such as TextPad. The following description describes how to edit the .idf file using a text file editor. Many of the generated files from a successful Energy Plus run can be read and edited using a text editor.
EnergyPlus is capable of producing a huge number of various simulation values on an hourly basis and reporting them to the “project_file_name.csv” file.
Step 1 - Choose the variables you want to see
To see what simulation values are available for tracking on an hourly basis please open the “project_file_name.rdd” file in a text editor. This file is available in the folder where the original downloaded .idf file from Sefaira was saved.

The “project_file_name.rdd” file is created in the project folder by E+ every time a simulation is successful. It is triggered by the "Output:VariableDictionary, idf;" object that needs to be in the .idf file (all .idf files downloaded via Sefaira should have this object). The list of available values will vary depending on the HVAC system that is selected by the user in the simulation. In this example, there are many variables which can be reported hourly. Others may only be reported monthly or annually.
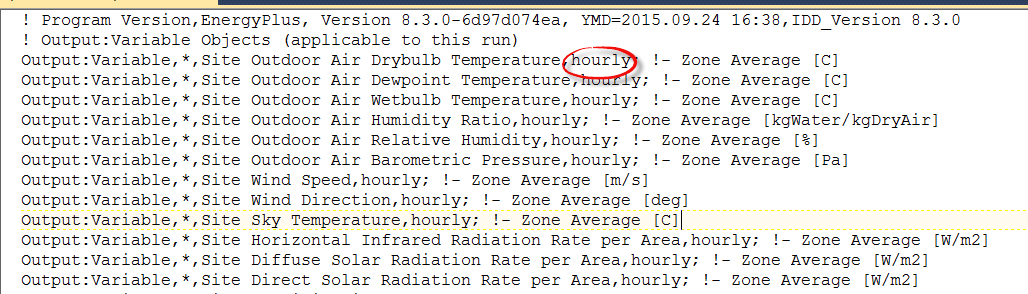
To add a specific hourly report variable to the .idf file simply copy the whole line of text from the “project_file_name.rdd” file and paste it in the available line anywhere in the “project_file_name.idf” file
Please note;
Note 1
The .idf file that you download from Sefaira will have many “Output:Variable” objects available for you. Our advice is to first remove them all and then input your own from the “project_file_name.rdd” file, otherwise your “project_file_name.csv” will have a huge number of columns and it will be hard to find the relevant information for your analysis.
Note 2
Output:Variable objects have the following structure:
Output:Variable,[object_name],[variable_name],hourly; !- [comment with unit]
[object_name] - in the “project_file_name.rdd” all variables will have “*” for this field which tells E+ to report everything that has this variable.
For example if your HVAC system is a fan coil system and you put the following variable;
"Output:Variable,*,Cooling Coil Total Cooling Rate,hourly; !- HVAC Average [W]",
this will report hourly cooling rates for all cooling coils i.e. each fan coil and the cooling coil for the AHU unit.
If you want to be more specific you can report a specific cooling coil hourly rate such as:
"Output:Variable,L001_C01 Cooling Coil,Cooling Coil Total Cooling Rate,hourly; !- HVAC Average [W]"
[variable_name] - is the name of the variable that you want to report. In this example "Cooling Coil Total Cooling Rate".
Step 2 - Setup Energy Plus to Run Hourly/Monthly
Before you run your “project_file_name.idf” file with the "Output:Variable" objects of your choice you need to update few lines in your “project_file_name.idf” file. All updates are in bold.
Update the RunPeriod object:

from
RunPeriod,
Run Period 1, !- Name
1, !- Begin Month
1, !- Begin Day of Month
1, !- End Month
1, !- End Day of Month
Thursday, !- Day of Week for Start Day
No, !- Use Weather File Holidays and Special Days
No, !- Use Weather File Daylight Saving Period
No, !- Apply Weekend Holiday Rule
Yes, !- Use Weather File Rain Indicators
Yes, !- Use Weather File Snow Indicators
1; !- Number of Times Runperiod to be Repeated
to
RunPeriod,
Run Period 1, !- Name
1, !- Begin Month
1, !- Begin Day of Month
12, !- End Month
31, !- End Day of Month
Thursday, !- Day of Week for Start Day
No, !- Use Weather File Holidays and Special Days
No, !- Use Weather File Daylight Saving Period
No, !- Apply Weekend Holiday Rule
Yes, !- Use Weather File Rain Indicators
Yes, !- Use Weather File Snow Indicators
1; !- Number of Times Runperiod to be Repeated
Update the SimulationControl object:

from
SimulationControl,
Yes, !- Do Zone Sizing Calculation
Yes, !- Do System Sizing Calculation
Yes, !- Do Plant Sizing Calculation
Yes, !- Run Simulation for Sizing Periods
No; !- Run Simulation for Weather File Run Periods
to
SimulationControl,
Yes, !- Do Zone Sizing Calculation
Yes, !- Do System Sizing Calculation
Yes, !- Do Plant Sizing Calculation
No, !- Run Simulation for Sizing Periods
Yes; !- Run Simulation for Weather File Run Periods
To Choose Monthly outputs
Follow the procedure that was described above.
The only change that needs to be made is to change “hourly” to “monthly” in the Output:Variable object. For example
From
Output:Variable,[object_name],[variable_name],hourly; !- [comment with unit]
To
Output:Variable,[object_name],[variable_name],monthly; !- [comment with unit]
It is a good practice not to have both hourly and monthly Output:Variable objects mixed in the same .idf file so please generate separate output files for hourly or monthly analyses.
Step 3 - Run the new Energy Plus file and take the output from Excel.
Returning to the Energy Plus Launcher and selecting the updated .idf file will allow you to Simulate the hourly/monthly analysis that you want. This new analysis will generate a .csv file in the source folder containing the information you require.
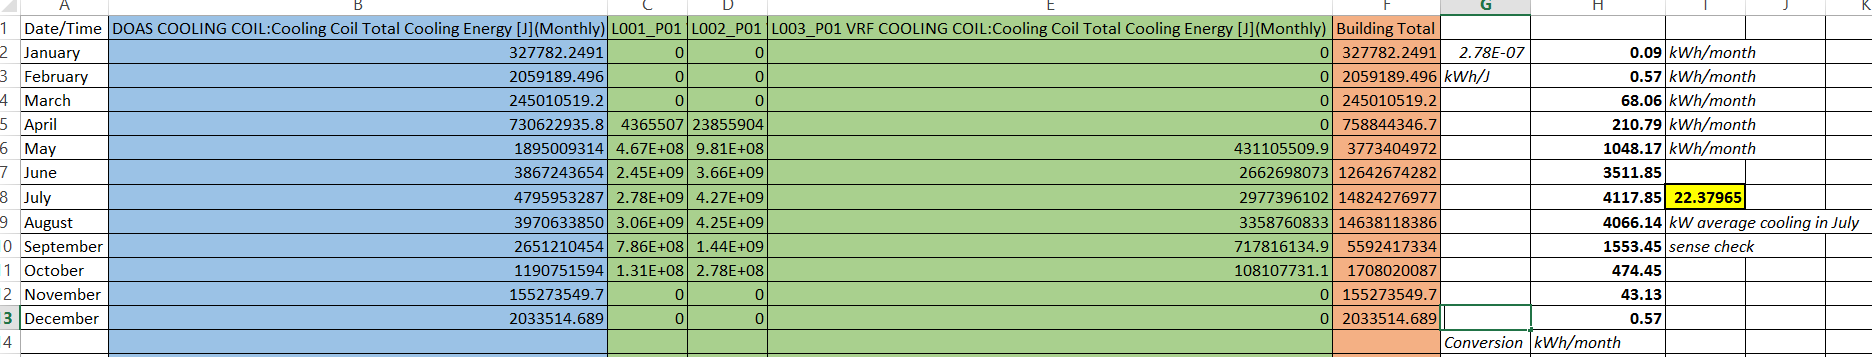
In this example, we selected monthly output for the DOAS Cooling Coil and 3 zones VRF Cooling Coils' Cooling Energy and then converted in excel from Joule to kWh. The sum of these 4 columns gives the building total system load. We sense check the peak month cooling load to validate the Energy Plus outputs are the correct ones that we require e.g. 22kW average cooling capacity during occupied hours in July.
Summary
Using a simple SketchUp model, brief setup for comparison and sizing in Sefaira web application and then a few edits in Energy Plus you can obtain many combinations of more granular output. The information above can be combined with the peak sizing information from the web application to size and estimate the consumption for a tri-generation system, for example.
Comments