 Rob O'Connor
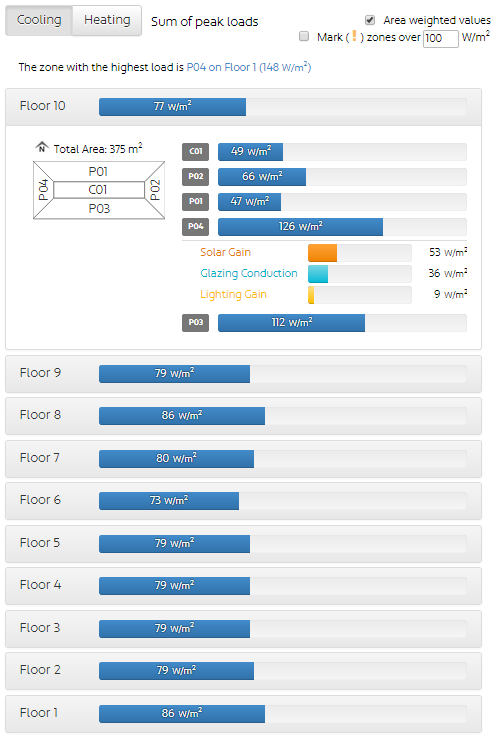
The Peak Loads section shows each automatically zoned floor of your building and the 3 major heating and cooling loads in the space.
In this example, we can see the area weighted cooling load values per floor for our 10 floors.
We have clicked on Floor 10 to see in more detail the Core and Perimeter zones of the building. We can click again on any zone to see the three largest loads that contribute to cooling in the zone - solar gain, glazing conduction and lighting gain.
This will be recalculated and saved for every strategy that you investigate.
For example, by changing the SHGC of the glazing in a new strategy the relative size of the loads in the zone will change;
This information can then be further targeted by ticking the 'Mark (!) zones over ___ W/m2' and entering a target value for cooling load in the zone. In this case, we have set 100 W/m2 as the threshold to show affected zones.

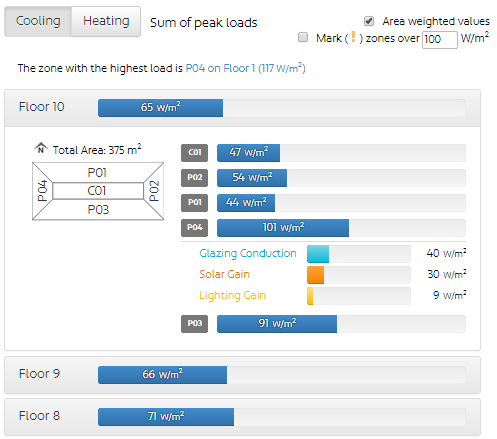
- This example is for cooling loads. Click 'Heating' to do the same for heating loads in each zone,
- The highest loaded zone is highlighted at the top of the highest floor - in this example 'The zone with the highest load is P04 on Floor 1' and the load is 117W/m2,
- The units can be changed between area weighted and actual load values by clicking 'Area weighted values'
- The values shown under each zone peak are 'non-coincidental' peaks which is explained further here. The dark blue value is derived from the coincidental peak and the sub-values are not meaning that they may occur at different times. The coincidental peak is the value relevant for plant/equipment design.
For information on the export output formats see our report export page.
For further queries on Sefaira web application outputs contact support@sefaira.com.
Comments